SoFi Hong Kong New Features: Technical Indicators
Estimated reading time: 1 minute
Technical vs Fundamental Analyses
In general, investors depend on two types of analyses: technical and fundamental. In the realm of long-term investment analysis, fundamentals primarily examine the three most significant financial statements of a company. How do short-term investors compare? Introducing today are the technical analysis instruments that we are discussing.
A series of indicators derived from historical data of a company, including daily price, trading volume, trend, average cost over a specific period, and so forth, serve as critical components of technical analysis in the stock market. Various technical indicators enable investors to forecast future trends based on historical short-term performance data and stock behavior.
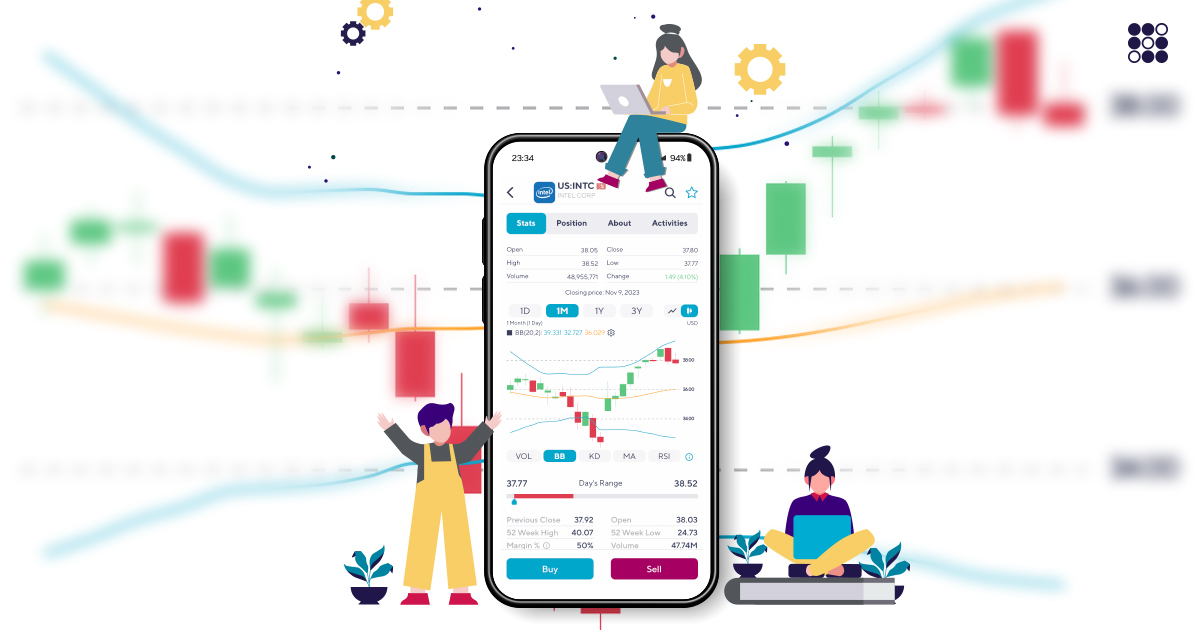
5 New Technical Indicators
The Stochastic Oscillator , Trading Volume, Relative Strength Index (RSI), Bollinger Band (BB), and Moving Average are among the five main technical indicators that SoFi Hong Kong has recently incorporated. This enables individuals to conduct a more comprehensive technical analysis of the trend and conclude at judicious conclusions. Stay tuned for the upcoming content with the origins and commonly used scenarios for these five major technical indicators.


About SoFi Hong Kong
SoFi – Invest. Simple.
SoFi Hong Kong is the All-in-One Super App with stock trading, robo advisor and social features. Trade over 15,000 US and Hong Kong stocks in our SoFi App now.