RSI
Estimated reading time: 4 minutes
Relative Strength Index (RSI)
A widely used technical analysis indicator, the Relative Strength Index (RSI) gauges the momentum and strength of a stock. The concept was developed by J. Welles Wilder in 1978. RSI is determined by comparing relative strengths, normally over the past 14 trading days. The general methods for calculating RSI are as follows:
- Determine the price change for each trading day by calculating the variation between the day’s closing price and the day before’s closing price.
- Calculate the cumulative price changes on days when prices increased (Positive Sum), followed by the sum of variations on days when prices decreased (Negative Sum).
- Calculate the RSI value by applying the following formula:
RSI = 100 – (100/ (1 + (Positive Sum / Negative Sum))).
The RSI is between 0 and 100. A region exceeding 70 is typically regarded as overbought, while a region falling below 30 is typically regarded as oversold. An RSI value in roughly the range of 50 indicates that buyers and vendors are similar. The application of the Relative Strength Index (RSI) is complex. The following are popular applications:
- The price may be excessively high and the trend or correction may be imminent when the RSI is in the overbought zone; conversely, if the RSI is in the oversold zone, the price could possibly be extremely low and the trend or recovery may be imminent when it is in the oversold zone.
- A weakening signal occurs when the RSI fails to follow the new high of the stock price, suggesting an impending decline; conversely, a strengthening signal is suggested when the RSI does not follow the new low of the stock price, indicating an imminent rise.
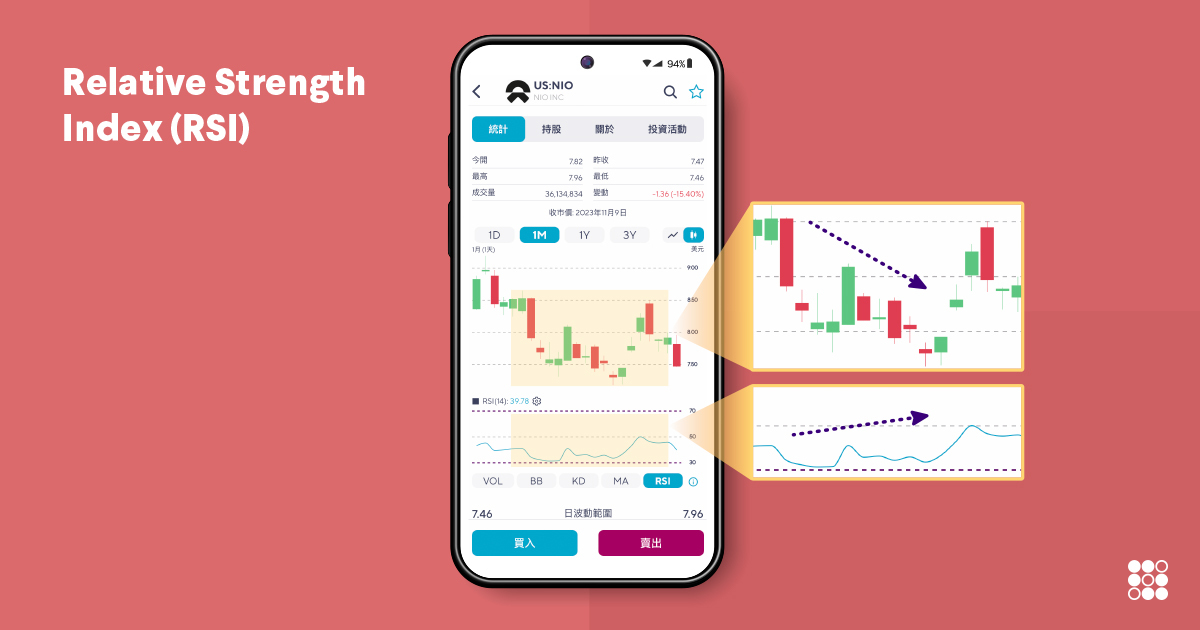
- A divergence in the RSI, which occurs when the price simultaneously reaches a new high or low while the RSI fails to do the same, could potentially signify an increased probability of a trend reversal. (refer to image)
It is important to remember that when applying the relative strength index (RSI) as a technical indicator, it must be interpreted and applied with caution. Additionally, it should be utilized in conjunction with other indicators and analysis methods. The relative strength index (RSI) could draw varying responses and conclusions from different trading assets and markets. Consequently, traders are advised to adjust their assessments and evaluations to particular circumstances.
When the RSI surpasses 70, for instance, investors might conclude that the stock price is excessively high and consequently exit the market with profits. Nonetheless, subsequent opportunities for rising prices are lost as the stock price continues to rise; if the RSI enters the market below 30, it will confront There is a possibility that the stock price will continue to decline, and investors may become tangled in the situation due to the RSI.
Disclaimer
SoFi Securities (Hong Kong) Limited and its affiliates (SoFi HK) may post or share information and materials from time to time. They should not be regarded as an offer, solicitation, invitation, investment advice, recommendation to buy, sell or otherwise deal with any investment instrument or product in any jurisdictions. Keep in mind that investing involves risk, and past performance of an asset never guarantees future results or returns. It’s important for investors to consider their specific financial needs, goals, and risk profile before making an investment decision.
SoFi HK does not make any warranties about the completeness, reliability and accuracy of this information and will not be liable for any losses and/or damages in connection with the use of this information.
The information and materials may contain hyperlinks to other websites, we are not responsible for the content of any linked sites. The information and analysis provided through hyperlinks to third party websites, while believed to be accurate, cannot be guaranteed by SoFi HK. These links are provided for informational purposes and should not be viewed as an endorsement. The risk involved in using such hyperlinks shall be borne by the visitor and subject to any Terms of Use applicable to such access and use.
Any product, logos, brands, and other trademarks or images featured are the property of their respective trademark holders. These trademark holders are not affiliated with SoFi HK or its Affiliates. These trademark holders do not sponsor or endorse SoFi HK or any of its articles.
Without prior written approval of SoFi HK, the information/materials shall not be amended, duplicated, photocopied, transmitted, circulated, distributed or published in any manner, or be used for commercial or public purposes.


About SoFi Hong Kong
SoFi – Invest. Simple.
SoFi Hong Kong is the All-in-One Super App with stock trading, robo advisor and social features. Trade over 15,000 US and Hong Kong stocks in our SoFi App now.