Stochastic Oscillator: A technical indicator to predict stock price trends
Estimated reading time: 4 minutes
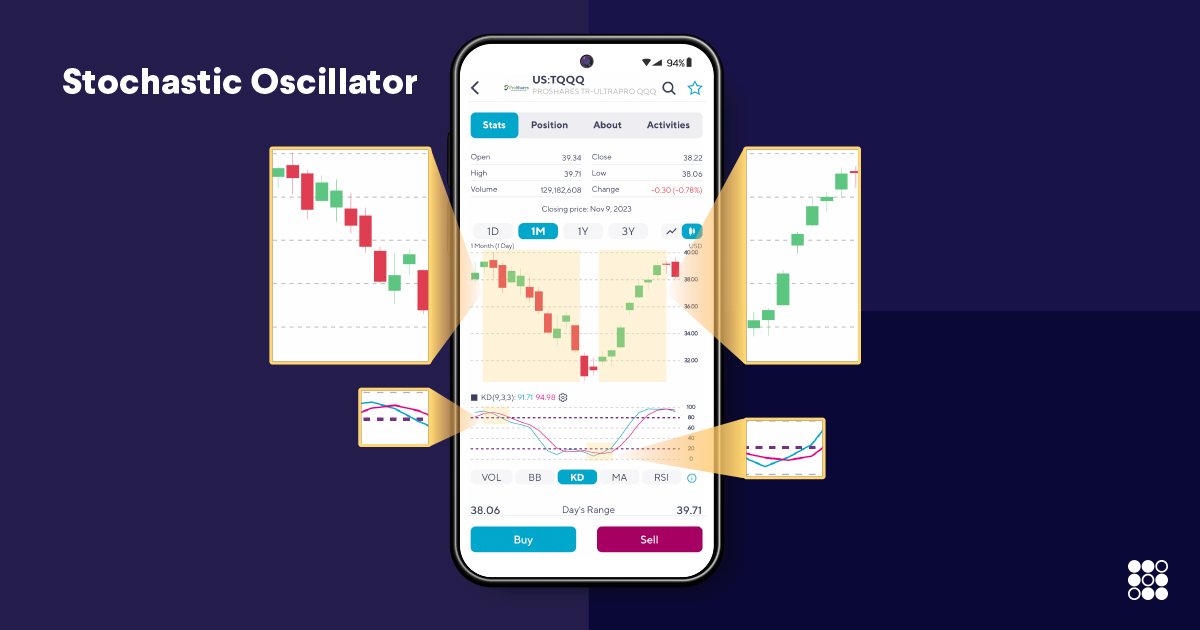
Stochastic Oscillator
Technical indicators are frequently employed by traders and investors in the stock market to predict stock price trends. One well-known and widely used indicator is the Stochastic Oscillator. This article will introduce the principles of the Stochastic Oscillator and its general usage methods, aiming to enhance your understanding and application of this powerful technical tool.
1. Principles of the Stochastic Oscillator:
The Stochastic Oscillator is a widely known technical indicator used to identify overbought and oversold conditions and the strength of stock price movements. It consists of two lines: the K line (fast line) and the D line (slow line). The K line represents the relative price changes over a recent period, while the D line is a smoothed moving average of the K line. When the K line and D line cross over, it is often considered a reference for buying or selling stocks.
2. General Usage Methods of the Stochastic Oscillator:
- Overbought and Oversold: Stochastic Oscillator operates on a scale of 0 to 100. When the readings surpass 80, the asset is deemed overbought, indicating the possibility of a price decline. It is deemed oversold when the measurements fall below 20, indicating that its price may be anticipating a possible uptrend. Investors can adjust their trading strategies based on these signals, such as considering selling or buying stocks.
- Crossover signals: A bullish signal is generated when the K line crosses the D line upward, denoting a Golden Cross; conversely, a bearish signal is indicated by the K line crossing the D line downward, signifying an impending Death Cross. (As shown in the picture) Crossing signals can provide valuable hints for capturing market turning points and executing trades at the appropriate timing.
- Combine usage with trend analysis: The Stochastic Oscillator can be combined with trend analysis to help us gain a better understanding of market trends. When the market is in an upward trend, you can look for buying opportunities based on oversold signals, while in a downward trend, you can look for selling opportunities based on overbought signals. This combination can enhance trading opportunities and success rate.
- Divergence: When there is a divergence between the price trend and the Stochastic Oscillator, it is referred to as a divergence in the Stochastic Oscillator. Specifically, when the price reaches a new high or new low, but the Stochastic Oscillator fails to reach a corresponding new high or new low, it indicates a divergence. Divergence is often considered a technical signal that suggests a potential trend reversal. For example, in an uptrend, when the price reaches a new high but the Stochastic Oscillator fails to reach a new high, it may indicate exhaustion in the trend and an increased likelihood of a downturn. Similarly, in a downtrend, when the price reaches a new low but the Stochastic Oscillator fails to reach a new low, it may indicate an increased likelihood of a trend reversal. However, it’s important to note that divergence in the Stochastic Oscillator serves as a technical signal and does not guarantee a trend reversal.It is commonly used in conjunction with other technical indicators and analysis methods to further confirm and validate the signal, leading to more informed trading decisions.
Disclaimer
SoFi Securities (Hong Kong) Limited and its affiliates (SoFi HK) may post or share information and materials from time to time. They should not be regarded as an offer, solicitation, invitation, investment advice, recommendation to buy, sell or otherwise deal with any investment instrument or product in any jurisdictions. Keep in mind that investing involves risk, and past performance of an asset never guarantees future results or returns. It’s important for investors to consider their specific financial needs, goals, and risk profile before making an investment decision.
SoFi HK does not make any warranties about the completeness, reliability and accuracy of this information and will not be liable for any losses and/or damages in connection with the use of this information.
The information and materials may contain hyperlinks to other websites, we are not responsible for the content of any linked sites. The information and analysis provided through hyperlinks to third party websites, while believed to be accurate, cannot be guaranteed by SoFi HK. These links are provided for informational purposes and should not be viewed as an endorsement. The risk involved in using such hyperlinks shall be borne by the visitor and subject to any Terms of Use applicable to such access and use.
Any product, logos, brands, and other trademarks or images featured are the property of their respective trademark holders. These trademark holders are not affiliated with SoFi HK or its Affiliates. These trademark holders do not sponsor or endorse SoFi HK or any of its articles.
Without prior written approval of SoFi HK, the information/materials shall not be amended, duplicated, photocopied, transmitted, circulated, distributed or published in any manner, or be used for commercial or public purposes.


About SoFi Hong Kong
SoFi – Invest. Simple.
SoFi Hong Kong is the All-in-One Super App with stock trading, robo advisor and social features. Trade over 15,000 US and Hong Kong stocks in our SoFi App now.