Not All Debt Is Created Equal
Estimated reading time: 8 minutes
Uncle Sam Never Stops Borrowing
If you follow financial news, you’ve probably noticed that debt is back in the headlines. There’s a lot of chatter about tech companies borrowing heavily to fund artificial intelligence infrastructure. There’s also more attention being paid to the growing federal budget deficit due to recent Treasury Department efforts to quell market volatility. Take these two juicy topics, add in that household debt continues to set record highs, and it’s easy to write an alarmist story about debt.
But these are three distinct types of debt, and to cultivate real understanding, you have to dig deeper.
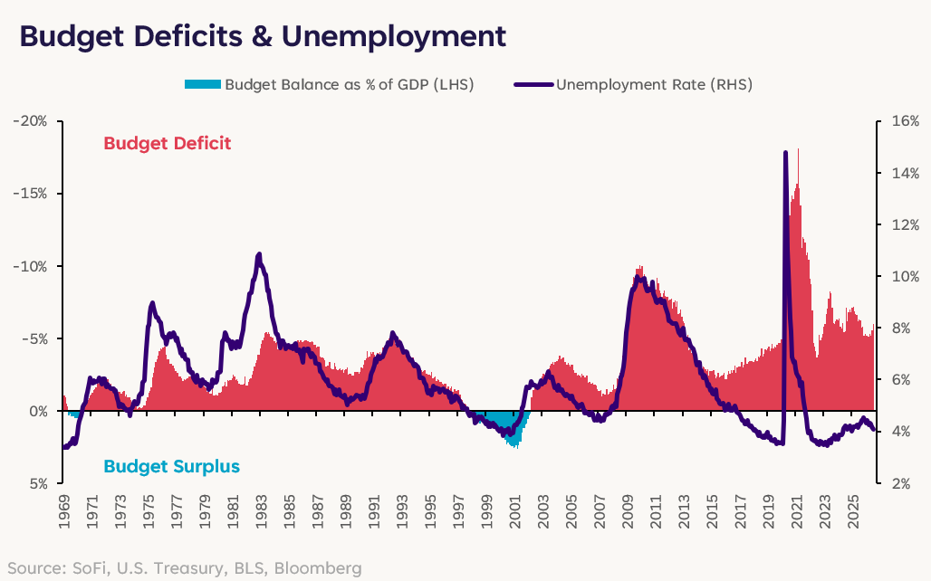
Let’s start with the government. The latest data from the Treasury Department showed the budget deficit unexpectedly widened from 5.6% to 6.0% of GDP in July, amounting to nearly $2 trillion annualized. Over the last four years, it’s been well above the long-term average of 3.4%, oscillating between 5% and 7%.
What’s weird is that this is happening even though we have a historically low unemployment rate of 4.2%. In the past, lower unemployment meant a narrower deficit or even a surplus, but that relationship broke around 2015 for reasons that are still being debated. In fact, prior to 2015, the average budget deficit when unemployment was below 5% was actually zero — a balanced budget.
When the economy is strong, the idea is that deficits should shrink because government support isn’t needed. If anything, it’s supposed to be a time to “pay back” for earlier fiscal stimulus and/or get ahead of future stimulus. When the economy is weak or in recession, the reverse can happen: The government can step in to stimulate and support consumer demand.
Today, however, the deficit is already at fairly wide levels suggesting a bad trajectory for government borrowing the next time the economy needs help.
Complicating matters further is how much government debt the public holds. Overall debt held by the public is nearly 100% of GDP and on an upward trajectory. Meanwhile, net interest payments amounted to $1.06 trillion in the last year, a year-over-year increase of 11%. To put it into context, the government is now spending more on interest than it does on national defense, and more than any single line item besides Social Security and Medicare.
There’s also an insidious relationship between rising interest rates and high debt levels: When more money goes to interest payments, there’s less for other expenses and as a result, more borrowing is needed (if revenues don’t increase). And that dynamic can spiral.
To be clear, though, this doesn’t mean the United States is at risk of defaulting on its debt. The U.S. issues debt in its own currency, so unless investor demand dries up and the dollar loses its status as the global reserve currency, this is primarily a budget and accounting story.
Room to Borrow
The second driver of all the debt headlines is the historic AI buildout. Analysts currently project over half a trillion dollars of global AI-related debt issuance in 2026, more than double last year’s. The hyperscalers (Amazon, Alphabet, Meta, Microsoft, and Oracle) have already issued about $177 billion year-to-date, dwarfing the $143 billion issued in all of 2025. Total Investment Grade corporate issuance has already surpassed $2.42 trillion this year, above the $2.26 trillion seen through the first eight months of 2020.
If this all sounds like a lot, it is. But it’s important to remember that these are incredibly profitable companies that have been choosing to borrow to fund an infrastructure boom and their AI ambitions. That’s a bit different than a distressed company taking on even more debt — or the government increasingly spending more than it’s bringing in. A good way to quantify this is by looking at net debt/EBITDA ratios (a measure of much debt a company is taking on relative to its earnings potential). It currently sits at 1.57 for the broad S&P 500, but just 0.72 for the hyperscalers.
Though characterizing borrowing trends as a crisis would be premature, things are shifting. The capex trajectory is so large that even the hyperscalers are hitting their limits, with free cash flow plummeting toward zero this year and is expected to be meaningfully negative in 2027.

The only way to make the math work here is to take on debt, and that’s what the market expects. If you add a growing supply of corporate debt issuance on top of the already-high government debt issuance, it’s no surprise that bond investors have started demanding higher yields. And because AI-related demand is relatively price-insensitive — the idea being to invest in the technology of the future, whatever the cost — it effectively crowds out other investments and increases the cost of capital for non-AI investments.
Households Holding the Line
Consumer debt, the third element, has been more under the radar. The fear is that rising indebtedness could lead to a 2008 financial crisis sequel, but spoiler alert: We aren’t anywhere near that at this juncture.
During the pandemic of 2020-21, many American households locked in mortgage rates of less than half what homebuyers could secure today. And because their largest monthly expense is fixed (adjustable-rate mortgages aren’t as popular as they were two decades ago), the higher interest rates of the past four years have had a muted effect on homeowners.
Despite the fact that today’s homebuyers are taking on 30-year fixed mortgage rates averaging 6.65%, the average for all outstanding mortgages is just 4.33%, according to the latest available data. The spread between the two has been slowly narrowing since 2023, but remains wider than at any point since 1984.

We can zoom out even further and look at the overall debt service ratio (DSR), which measures the percentage of disposable income going toward debt payments. The latest data puts it at 11.2%, which is below levels seen at the end of 2007 (15.7%) and 2019 (11.8%) and suggests that consumers aren’t having much trouble with their debt obligations. This ratio has been fairly stable, and is unlikely to move up much if unemployment remains stable (or falls more).
Swimming in Warmer Water
So, if you see a scary headline about rising debt, it’s important to reflect on exactly whose debt we’re talking about: Government debt is a story about deficits, Treasury supply, and rising interest rates; Business debt is primarily a story about tech giants going all-in on AI; Household debt is a measure of whether families can pay their mortgages, auto loans, and credit cards.
They’re not interchangeable, though they can interact with each other (e.g. more corporate and Treasury borrowing can push yields and mortgage rates higher).
For investors, this nuance matters. The large federal deficit isn’t a reason on its own to dump your stocks. In fact, history suggests that large public deficits actually fuel hot economies – the mirror of a large public deficit is a large private surplus.
The hyperscaler borrowing boom is an AI-capex story, and it remains to be seen if it will all pay off. We may not know for years, however, and selling tech stocks simply because you think it’s a bubble that will pop later is an easy way to potentially miss out on gains today. Remember: Market timing is difficult.
Rising debts rarely manifest in a specific or sudden event. They’re usually felt in a diffuse manner. It’s like the boiling frog analogy. The water is certainly getting hotter, but it isn’t boiling yet.
Disclaimer
SoFi Securities (Hong Kong) Limited and its affiliates (SoFi HK) may post or share information and materials from time to time. They should not be regarded as an offer, solicitation, invitation, advice, recommendation to buy, sell or otherwise deal with any investment instrument or product in any jurisdictions. Keep in mind that investing involves risk, and past performance of an asset never guarantees future results or returns. It’s important for investors to consider their specific financial needs, goals, and risk profile before making an investment decision.
SoFi HK does not make any warranties about the completeness, reliability and accuracy of this information and will not be liable for any losses and/or damages in connection with the use of this information.
The information and materials may contain hyperlinks to other websites, we are not responsible for the content of any linked sites. The information and analysis provided through hyperlinks to third party websites, while believed to be accurate, cannot be guaranteed by SoFi HK. These links are provided for informational purposes and should not be viewed as an endorsement. The risk involved in using such hyperlinks shall be borne by the visitor and subject to any Terms of Use applicable to such access and use.
Any product, logos, brands, and other trademarks or images featured are the property of their respective trademark holders. These trademark holders are not affiliated with SoFi HK or its Affiliates. These trademark holders do not sponsor or endorse SoFi HK or any of its articles.
Without prior written approval of SoFi HK, the information/materials shall not be amended, duplicated, photocopied, transmitted, circulated, distributed or published in any manner, or be used for commercial or public purposes.
Crypto and Crypto ETF products are available only to members in eligible jurisdictions who have successfully completed the required assessments and maintain an appropriate risk profile.
This communication is not directed at, and is not intended for distribution to or use by, any person in the United Kingdom. It does not constitute a financial promotion for the purposes of Section 21 of the Financial Services and Markets Act 2000. This material is not available to any UK Person. By accessing, viewing, or relying on this communication, you represent and warrant that you are not a UK Person and that you are not located in the United Kingdom.


About SoFi Hong Kong
SoFi – Invest. Simple.
SoFi Hong Kong is the All-in-One Super App with stock trading, robo advisor and social features. Trade over 15,000 US and Hong Kong stocks in our SoFi App now.