Looking at: Relationship Problems
Estimated reading time: 0 minutes
Something’s Gotta Give
You’ve heard us talk about “relationship problems” in financial markets in the past. It’s the phrase we use to point out when variables that typically behave a certain way in relation to one another are behaving outside those norms. Often the abnormal behavior is not the “problem” per se, but that these relationship problems don’t last forever and are likely to correct themselves – eventually.
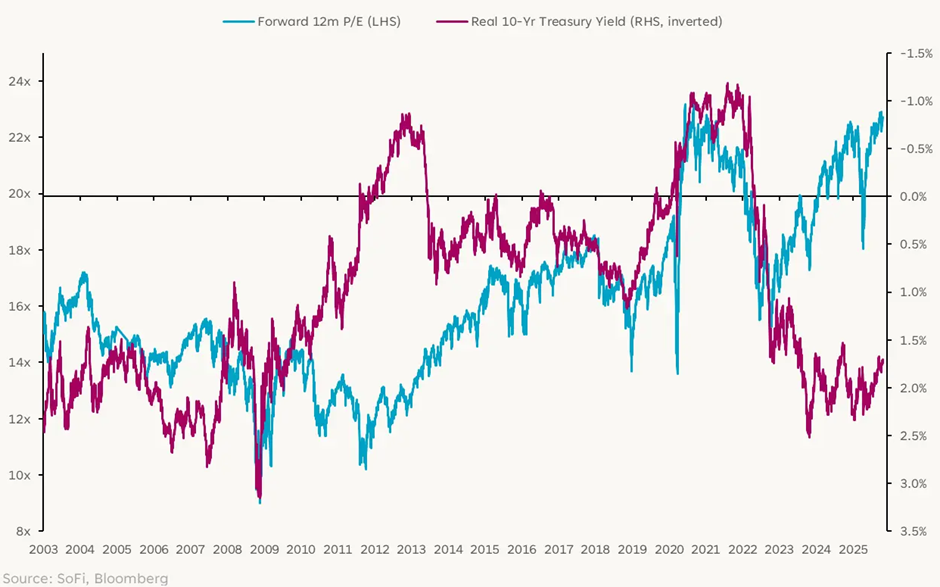
One of the most stark relationship problems of this cycle is the one between real Treasury yields and price-to-earnings ratios (P/Es). We’ve covered this one before, but it’s a biggie and it remains dislocated, so it deserves to be covered again.
In a typical environment, these lines should move in similar directions and be closer together. (Note: the real yield is inverted on this chart, when yields are rising the magenta line falls). In other words, the spread between them should be tighter, and as real yields fall (i.e. the magenta line rises), P/Es should rise (i.e. the blue line rises). That’s what a more typical relationship would look like.
That’s not what’s happening right now: The gap between the two is currently very wide and does not appear to be narrowing.
Stock Valuations & Real Rates
This relationship problem presented itself between 2010 and 2016, although in reverse – P/Es were on the bottom and real yields were on top (i.e. negative). It took roughly seven years for the lines to converge, and just like in rocky relationships that do get better, it happened through a combination of both variables moving.
How long will it take for the gap to narrow this time, and will the lines ever fully converge again?
This Ends One Way Or Another
We are of the mind that this time is not different, and the two lines will converge again. Others are of the mind that this time is different, and suggest that some relationships are forever changed. We can agree that the details and drivers of market environments do change thanks to innovation (financial and technological), product mixes, demographics, and regulations, but many conventional rules of market behavior do not.
Regardless of which school of thought you land in, the argument is one that will continue into perpetuity. There are periods of time when each side will look “right” and others where each side will look “wrong”. You can make money in either case.
Our expectation is that the gap between these two lines narrows slightly for a period of time before converging quickly and in a more dramatic fashion. The narrowing process could happen with the backdrop of a relatively healthy economy, sturdy profit margins, and fiscal and monetary policies that don’t present any major surprises. In that case, we’d expect real yields to fall and approach a level closer to 1% (currently 1.77%), and P/Es to compress slightly as earnings growth increases and market levels remain stable or even fall slightly.
We are roughly three years into this current dislocation, and as previously mentioned, the last major dislocation lasted six years. Perhaps we’re only halfway done, but there’s no knowing. What we do feel confident in is that the dislocation will end, one way or another.
Reading People’s Faces
If we were a gambler, we’d put my money on the P/E ratio being the element that has to move more than real yields. But that almost seems too easy. Of course it would make sense for some of the froth to come out of markets after three years (if we include 2025 YTD) of double-digit returns in the S&P and Nasdaq.
Nevertheless, we’re finding it very difficult to come up with ways the real yield would fall enough to narrow the gap. Particularly when looking at this chart of the nominal 10-year Treasury yield and real GDP growth.
Yields Usually Reflect Growth Expectations
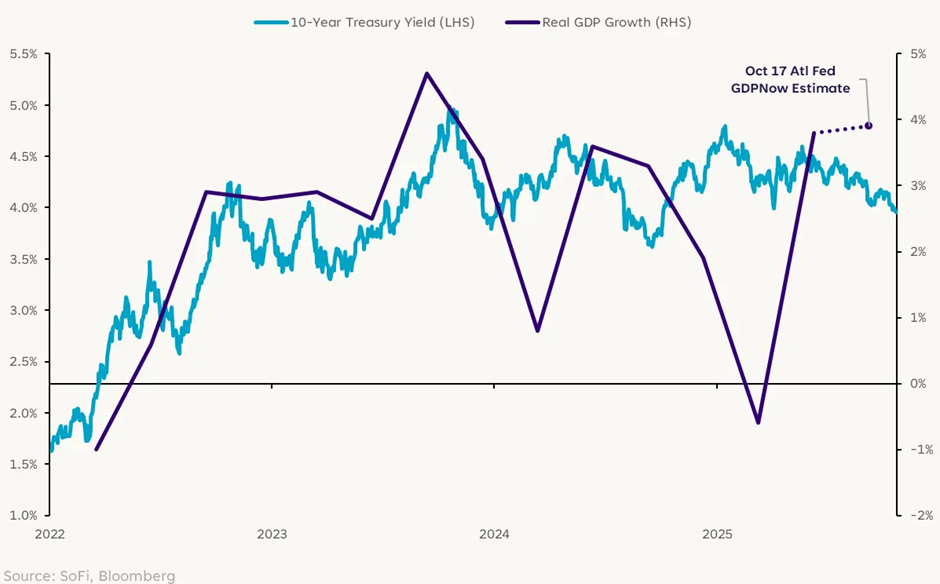
In theory, the nominal 10-year Treasury yield should be close to the sum of real GDP growth and 10-year inflation expectations. Currently, the 10-year yield is at 3.97%, 10-year inflation expectations are at 2.28%, and the latest expectation for Q3 GDP growth from the Atlanta Fed is 3.9% annualized.
That admittedly simple math would suggest the 10-year Treasury yield should be closer to 6.2%, which would make the gap between the two lines even wider. So that can’t be plausible (famous last words).
What we’re left with is a gap that is likely to narrow at some point, and the best we can do is make educated guesses about how that might happen. If it is in fact the P/E ratio that needs to fall, we all better brush up on our poker skills of reading people’s faces… because after all, our moves in the stock market are highly dependent on what we think other people are going to do with the same information.
As they say, this too shall pass (perhaps we learned that by watching the gold market this week.) I’m positioning for this to last a while longer, and for the more likely scenario to be a compression in P/Es.
Disclaimer
SoFi Securities (Hong Kong) Limited and its affiliates (SoFi HK) may post or share information and materials from time to time. They should not be regarded as an offer, solicitation, invitation, advice, recommendation to buy, sell or otherwise deal with any investment instrument or product in any jurisdictions. Keep in mind that investing involves risk, and past performance of an asset never guarantees future results or returns. It’s important for investors to consider their specific financial needs, goals, and risk profile before making an investment decision.
SoFi HK does not make any warranties about the completeness, reliability and accuracy of this information and will not be liable for any losses and/or damages in connection with the use of this information.
The information and materials may contain hyperlinks to other websites, we are not responsible for the content of any linked sites. The information and analysis provided through hyperlinks to third party websites, while believed to be accurate, cannot be guaranteed by SoFi HK. These links are provided for informational purposes and should not be viewed as an endorsement. The risk involved in using such hyperlinks shall be borne by the visitor and subject to any Terms of Use applicable to such access and use.
Any product, logos, brands, and other trademarks or images featured are the property of their respective trademark holders. These trademark holders are not affiliated with SoFi HK or its Affiliates. These trademark holders do not sponsor or endorse SoFi HK or any of its articles.
Without prior written approval of SoFi HK, the information/materials shall not be amended, duplicated, photocopied, transmitted, circulated, distributed or published in any manner, or be used for commercial or public purposes.


About SoFi Hong Kong
SoFi – Invest. Simple.
SoFi Hong Kong is the All-in-One Super App with stock trading, robo advisor and social features. Trade over 15,000 US and Hong Kong stocks in our SoFi App now.