Decoding Markets: Recovery Road

Estimated reading time: 6 minutes
Round Trip
It was February 19. Stocks were sitting at record highs, with the S&P 500 surpassing 6144. A rapidly shifting policy landscape was largely written off by investors as the typical early days of a new administration.
Then came April 2. On what President Trump called Liberation Day, he unveiled a baseline universal tariff on imports in addition to higher reciprocal tariffs. The market reaction was swift. Over the next week, stocks — already down 7.7% from their all-time highs — fell an additional 12% as investors grappled with what were likely to be the meaningfully negative effects of higher import costs.
The market carnage ended suddenly on April 9, when the administration announced a 90-day pause on tariffs to allow time for negotiations. The S&P 500 rose 9.5% that day, the 10th best day for stocks since 1927. Looking past major tit-for-tat retaliation with China and an eventual detente, stocks have nearly round-tripped all the way back, now sitting just 5% away from all-time highs.
If the pivot on trade policy was what ignited this rally, washed-out positioning and bearish sentiment, which reached its most extreme levels since 2022, served as fuel. Factors like this can affect price only for so long before fading, however. That looks to be happening now with the recent strong momentum losing some steam.
From a technical perspective, the S&P 500 might have encountered some resistance near 6000, a psychologically important round number. (For all its complexity, investing can sometimes be that simple – investors are humans after all). That this consolidation is happening after stocks have punched through several important retracement levels isn’t shocking or unhealthy. Digestion phases are normal.
S&P 500 Levels
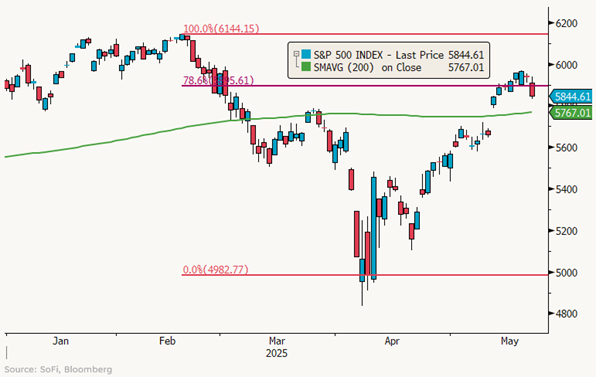
Just as certain price levels can serve as resistance, they can also serve as support. Given that market momentum has faded in recent days, investors could look to these levels for a “verdict” on the rally’s durability. Two such levels to keep in mind are the 200-day moving average currently at 5767 and the 78.6% retracement level at 5896. The S&P 500 has hovered around the latter in recent days and even fell below it yesterday.
How this clash of investor buying and selling shakes out is key. If support fails, it could be the beginning of a meaningful move lower for stocks.
Fundamentals Are King
Technical factors may affect markets in the short-term, but what matters over the long-term is fundamentals. And for now, things look rosy on that end.
With 94% of S&P 500 companies having reported first quarter results, earnings per share are tracking toward year-over-year growth of 11.2%, surpassing consensus expectations by 8.0%. This marked the second consecutive quarter of double-digit growth and the seventh straight quarter of positive growth.
Of course, all the recent upheaval has made these results a bit stale. Companies have been cautious about providing guidance with the outlook heavily dependent on what happens on the macroeconomic and trade policy front. Tariffs, in particular, have emerged as a major concern, with nearly all companies mentioning them this earnings season.
That’s not surprising. Tariffs can increase input costs, disrupt supply chains, and dampen consumer demand, thereby squeezing profit margins. This caution is further reflected in company guidance, which Bloomberg data suggests is at its most negative since 2015. Despite the negative direction, investor expectations for forward earnings have been pretty resilient: Forward 12m EPS consensus is $273, only 1.2% below the March 31 peak of $277.
S&P 500 Forward Earnings
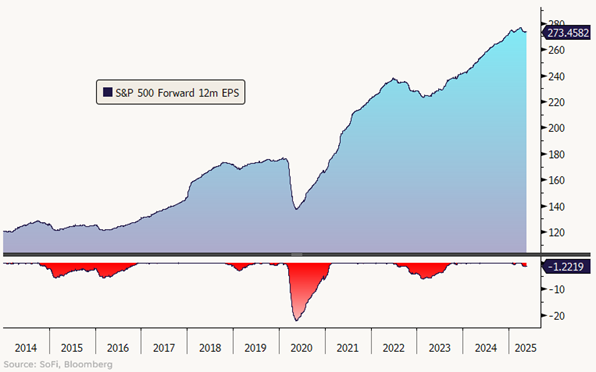
This is different from prior periods of non-recessionary market upheaval, which saw more deterioration in earnings expectations.
- The 2018-19 trade war (which, like now, had a Federal Reserve talking tough on interest rates) saw forward earnings estimates fall 3.1%.
- The period of negative guidance momentum a decade ago saw forward earnings estimates fall 5.7%.
- The inflation shock of 2022-23 saw forward earnings estimates fall 6.1%.
That’s not to mention recessionary drawdowns, which often see earnings revised lower by double-digit percentage points.
All in all, resilient earnings expectations have enabled stocks to recover recent losses, but that could be reversed if the macro backdrop changes. It might take some time to get that clarity though, which suggests the risk of the fundamentals breaking down in the immediate future is somewhat muted. Later in the summer, once trade deals are signed (or not) and tariffs are finally set in stone (or not), these concerns could pick up. But for now it’s spring and out of sight, out of mind.
The Bigger Picture
It would be remiss not to acknowledge that financial markets are more than just stocks. Gold, for instance, has been a standout performer in 2025, with the precious metal up nearly 27% this year alone. Aggressive purchasing globally by central banks seeking to diversify their reserves has provided strong underlying support. Gold is also typically seen as a hedge against inflation fears and U.S. dollar weakness, which have been market themes year-to-date.
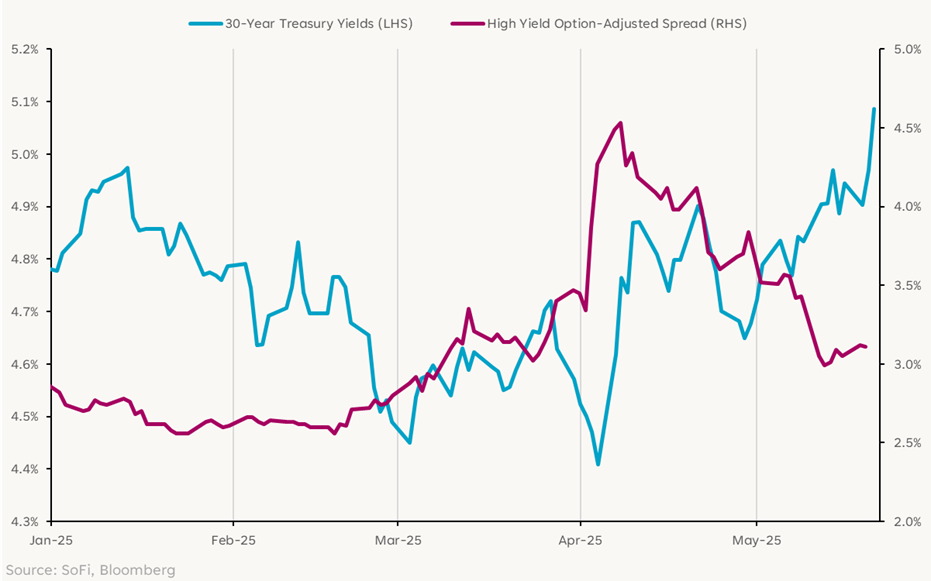
Bonds have been another asset class with a lot of action — especially U.S. Treasurys. The big shifts in inflation, economic growth, and Fed policy expectations has led to major whipsaw in what is typically seen as one of the safer investment options. Long-term Treasury yields fell 9-13 basis points in the first two days post-Liberation Day, before surging 45-50 basis points over the next week.
Bond Market Volatility
Disclaimer
SoFi Securities (Hong Kong) Limited and its affiliates (SoFi HK) may post or share information and materials from time to time. They should not be regarded as an offer, solicitation, invitation, investment advice, recommendation to buy, sell or otherwise deal with any investment instrument or product in any jurisdictions. Keep in mind that investing involves risk, and past performance of an asset never guarantees future results or returns. It’s important for investors to consider their specific financial needs, goals, and risk profile before making an investment decision.
SoFi HK does not make any warranties about the completeness, reliability and accuracy of this information and will not be liable for any losses and/or damages in connection with the use of this information.
The information and materials may contain hyperlinks to other websites, we are not responsible for the content of any linked sites. The information and analysis provided through hyperlinks to third party websites, while believed to be accurate, cannot be guaranteed by SoFi HK. These links are provided for informational purposes and should not be viewed as an endorsement. The risk involved in using such hyperlinks shall be borne by the visitor and subject to any Terms of Use applicable to such access and use.
Any product, logos, brands, and other trademarks or images featured are the property of their respective trademark holders. These trademark holders are not affiliated with SoFi HK or its Affiliates. These trademark holders do not sponsor or endorse SoFi HK or any of its articles.
Without prior written approval of SoFi HK, the information/materials shall not be amended, duplicated, photocopied, transmitted, circulated, distributed or published in any manner, or be used for commercial or public purposes.


About SoFi Hong Kong
SoFi – Invest. Simple.
SoFi Hong Kong is the All-in-One Super App with stock trading, robo advisor and social features. Trade over 15,000 US and Hong Kong stocks in our SoFi App now.