Looking At: Echoes of the Past
Estimated reading time: 8 minutes
We didn’t like history as a teenager, which was ironic because my dad was a high school history teacher. We didn’t see the allure in learning about a bunch of old wars or fallen empires. Shouldn’t we focus on the empires that were still standing? Or the wars that are happening now?
Then we entered the world of finance and realized that history is often our best teacher. Investors tend to refer to history for warnings of where the next threat could be hiding, but in the case of this rally, perhaps we should look to history for indications of how long it could last.
We’ve all heard stats on the current extended state of the market: Valuations on the S&P are in the 95th percentile, the Buffett indicator is at all-time highs, technology spending as a % of GDP is above that of the dot-com bubble, and the list goes on. However, as the famous quote goes, “Bull markets don’t die of old age.” That’s not where the quote ends, but we’ll get to the rest of it later.
The most natural historical comparison we can make is to the internet era of the 1990s, when hype was building and investors believed the world would never be the same. Markets were right, the world would change dramatically because of the internet, it just took longer than we expected and stocks went through a rationalization phase before we understood the full story.
The big questions are: Will the AI era follow a similar path? If so, where are we on that timeline right now?
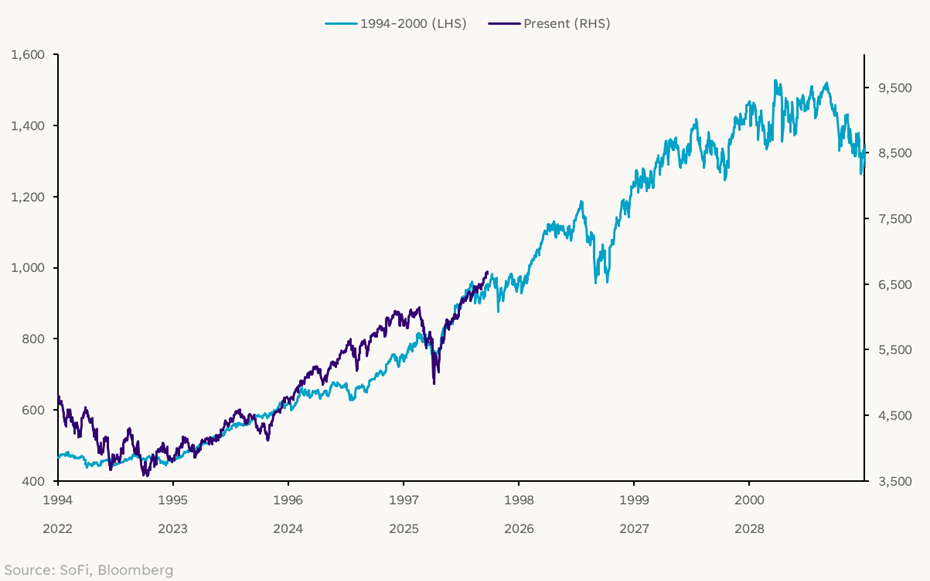
Starting with a simple comparison of the S&P 500 then and now, we see some fascinating parallels. In the chart below, light blue is the internet era and dark blue is the present. Both time periods begin in the year when the Fed started a rate hike cycle in response to a strong or overheating economy. And in both periods, markets stumbled a bit as investors digested more hawkish monetary policy.
S&P 500: Then and Now
So far, the paths look pretty darn similar, even including the drawdowns that occurred in April 1997 and April of this year. The clearest takeaway here is if the two cycles do end up resembling each other, we’ve still got some runway before this market rally loses steam.
On a historical chart like this, it’s easy to look at the whole period as a relatively smooth bull market, but living it day-to-day probably didn’t feel that way, especially during those intermittent periods of pullbacks. For example, a quick search for “market headlines in 1998” brought this up from the New York Times: “Sell-Off Pushes Index Below 7,600 And Wipes Out All Gains for 1998: Dow Drops 500 in Market Frenzy.” Investors weren’t feeling very confident in the rally at that point, but the market continued to rise another 60% until it topped in early 2000.
Every pullback in the midst of these long rallies feels like it might be the one that ends it, but it’s not over till it’s over.
Cue the Fed
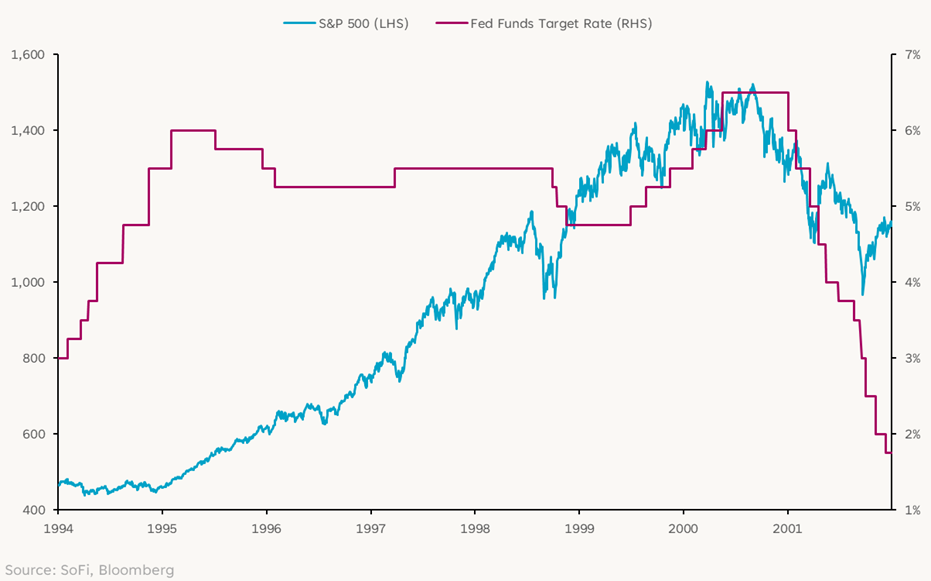
Technology isn’t the only market story in these scenarios though, the Fed is another major player in both periods. Last week’s rate cut can be considered an “adjustment cut,” meaning Fed officials cut rates because they could not because they had to. There is no crisis, the economy isn’t contracting. The message is that things are slowing down and it’s appropriate to move the fed funds rate closer to neutral.
The story was the same in 1995 when Fed cuts began and progressed in a slow and careful fashion. There was even a long pause in the cuts (perhaps similar to the pause we just experienced from December 2024 until September 2025). During the cuts and the pauses from 1995 through mid-1999, the market continued to rally. Sound familiar?
More interestingly, the Fed started hiking rates again in 1999, taking the fed funds rate from an upper bound of 5.0% to 6.5% by May 2000… and the market still kept rallying!
The Internet Era
This made us curious about how similar the sector composition looked then versus now. We know that in both instances, technology stocks were/are the darlings. We also know that technology companies didn’t have nearly the size and scale in the 90s that they do today. But the data tracking the growth of tech over both periods is remarkable.
Tech went from 6% of the index before the internet boom to 35% of the index at the 2000 top, largely because many new tech companies were added to the S&P 500 as they grew. That’s growth so large we almost can’t wrap my head around it. In the current period, tech stocks were already at 27% of the index before AI became the theme du jour, and the sector has grown to be 34% of the index today. If we add in the four Mag 7 stocks that aren’t in the tech sector (Alphabet, Amazon, Meta, Tesla), that percentage moves to 49%. Staggering? Yes. Over? Perhaps not.
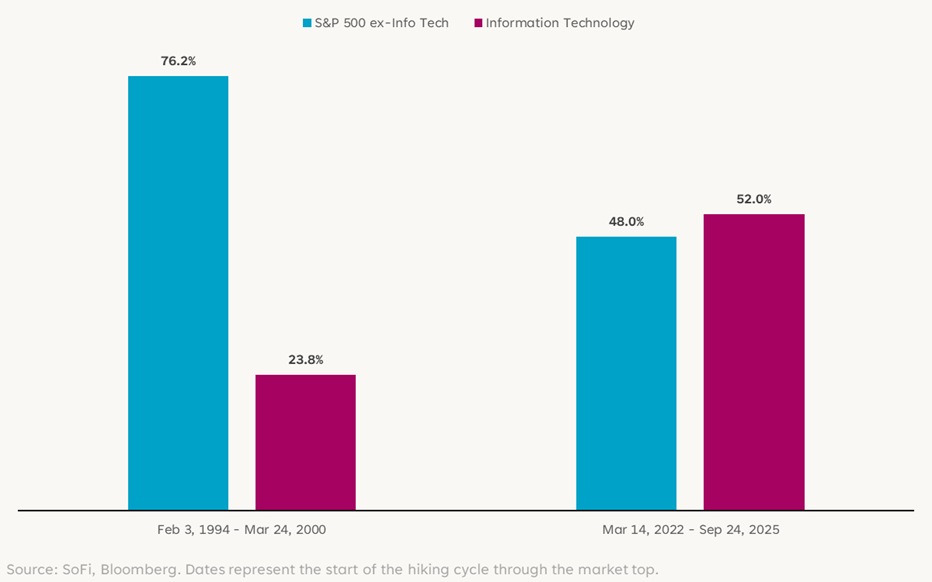
Interestingly, although we talk about the dot-com period being solely driven by tech stocks, the proportion of returns tells a different story. Tech as a sector only accounted for roughly 24% of the S&P 500’s total return during that period, while in the AI era, tech stocks account for more than half of the S&P’s total return. Today’s market is more concentrated than the one of the 90s by this metric, which can present more risk, but also more opportunity for other sectors to step into the limelight if the economy remains solid.
Contributions to S&P 500 Total Returns
Here’s where the rest of that famous quote comes in: “Bull markets don’t die of old age, but rather they’re killed by the Federal Reserve.”
We can see in the chart of the internet era above that although markets rallied through the Fed hikes in 1999 and 2000, things took a turn for the worse shortly afterward. To be fair, the Fed wasn’t the full or even the main reason stocks fell sharply starting in 2000. The backdrop was that of a major speculative bubble in tech stocks, and the beginning of investors withdrawing capital. But paired with said speculative bubble was an economy that looked to be overheating as the exuberance drove inflation concerns and wage pressures.
The Fed is responsible for maintaining stable prices and maximum employment. Often, their dual mandate rings alarm bells that coincide with periods of sharp increases or decreases in financial markets — It’s all related.
We are a firm believer in the business cycle, and a firm opponent of a “this time is different” mentality. But even with those principles intact, the parallels between then and now suggest that this rally, the AI hype, and economic strength may still be relatively young. It also suggests that Fed rate hikes may not be the kryptonite we’ve made them out to be… at least not right away.
We won’t know how this all shakes out until it’s over, but for now, it’s hard to envision it stopping in the near- or medium-term. Sometimes all-time highs just continue begetting more all-time highs. Be prudently present for that possibility.
Disclaimer
SoFi Securities (Hong Kong) Limited and its affiliates (SoFi HK) may post or share information and materials from time to time. They should not be regarded as an offer, solicitation, invitation, investment advice, recommendation to buy, sell or otherwise deal with any investment instrument or product in any jurisdictions. Keep in mind that investing involves risk, and past performance of an asset never guarantees future results or returns. It’s important for investors to consider their specific financial needs, goals, and risk profile before making an investment decision.
SoFi HK does not make any warranties about the completeness, reliability and accuracy of this information and will not be liable for any losses and/or damages in connection with the use of this information.
The information and materials may contain hyperlinks to other websites, we are not responsible for the content of any linked sites. The information and analysis provided through hyperlinks to third party websites, while believed to be accurate, cannot be guaranteed by SoFi HK. These links are provided for informational purposes and should not be viewed as an endorsement. The risk involved in using such hyperlinks shall be borne by the visitor and subject to any Terms of Use applicable to such access and use.
Any product, logos, brands, and other trademarks or images featured are the property of their respective trademark holders. These trademark holders are not affiliated with SoFi HK or its Affiliates. These trademark holders do not sponsor or endorse SoFi HK or any of its articles.
Without prior written approval of SoFi HK, the information/materials shall not be amended, duplicated, photocopied, transmitted, circulated, distributed or published in any manner, or be used for commercial or public purposes.


About SoFi Hong Kong
SoFi – Invest. Simple.
SoFi Hong Kong is the All-in-One Super App with stock trading, robo advisor and social features. Trade over 15,000 US and Hong Kong stocks in our SoFi App now.