Moving Averages
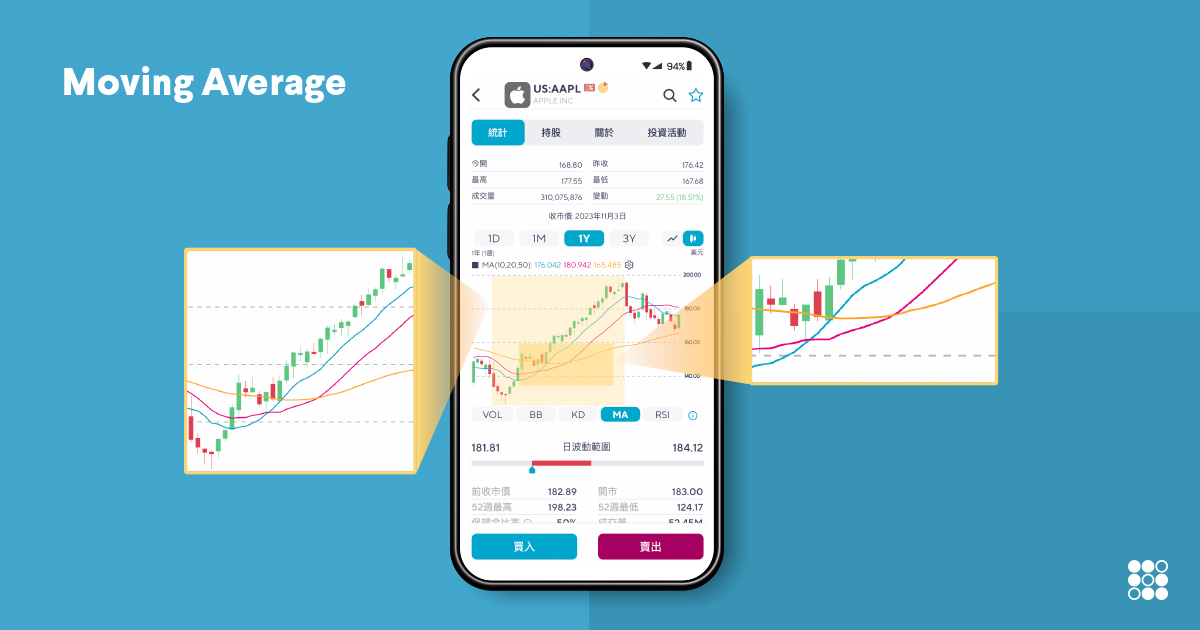
Moving Averages are a key indicator in technical analysis and appear in a variety of forms. Among them, the Simple Moving Average (SMA) is the most simple to understand, making it ideal for everyone including beginner investors. A simple moving average smoothes variations in stock or other asset values by computing the average price of an asset over a particular time period. It eliminates short-term price fluctuations and creates a smooth trend line, allowing investors to identify long-term price patterns and potential turning points. The 10 days, 20 days, 50 days, and 250 days are all common time periods. Investors could use simple moving averages to figure out the trend direction and price crossing points, and then develop appropriate investing strategies.
For example, if we would like to calculate a stock’s 10-day moving average, we have to select the closing prices from the previous 10 trading days. Assume the closing prices for these ten trading days were 100, 105, 110, 115, 120, 118, 116, 114, 112, and 110. We add these closing prices to get 1120, and then divide 1120 by 10 to get 112 as the price of the 10-day moving average. We can calculate the 10-day moving average each day by adding the closing prices for that day and the previous nine days, dividing by 10, and so on. This will show the 10-day moving average on the screen. Moving averages are commonly used as follows:
- Trend Assessment: When a short-term moving average (such as the 10-day or 20-day moving average) is higher than a longer-term moving average (such as the 50-day or 200-day moving average), an asset is probably in a shorter-term uptrend. When the short-term moving average is lower than the long-term moving average, the asset is possibly in a downtrend.
- Support and resistance: Moving averages could be a reference of support and resistance. The moving average could be a support level when the price drops nearby, and the moving average becomes a resistance when the price rises nearby the moving average.
- Crossover signals: When moving averages of different periods cross, a trading signal is triggered. Two standard cross situations are the golden cross and the death cross.
- The Golden Cross occurs when the short-term moving average crosses above the long-term moving average. For example, a golden cross signal occurs when the 10-day moving average crosses above the 50-day moving average. This indicates that asset prices might shift from a slump to a shorter-term uptrend, which might suggest a purchasing opportunity. Many investors take the golden cross as a sign of a market reversal and a chance to enter or add to positions.
- The Death Cross occurs when the short-term moving average crosses below the long-term moving average. For example, a death cross signal occurs when the 10-day moving average crosses below the 50-day moving average. This indicates that the asset price could shift from an uptrend to a decline. Many investors perceive the death cross as an a sign of market weakness or reversal, and they may consider lowering their positions or leaving the market.
Please note that more precise forecasts can be obtained by combining Moving Averages with additional indicators. The moving average is a delayed indicator computed using historical prices that should not be applied as a sole basis for decision-making in investments. For improved judgment, investors should assess the market situation holistically. Reactions to trading assets and markets may vary; therefore, investors must evaluate and assess on a case-by-case basis.
Disclaimer
SoFi Securities (Hong Kong) Limited and its affiliates (SoFi HK) may post or share information and materials from time to time. They should not be regarded as an offer, solicitation, invitation, investment advice, recommendation to buy, sell or otherwise deal with any investment instrument or product in any jurisdictions. Keep in mind that investing involves risk, and past performance of an asset never guarantees future results or returns. It’s important for investors to consider their specific financial needs, goals, and risk profile before making an investment decision.
SoFi HK does not make any warranties about the completeness, reliability and accuracy of this information and will not be liable for any losses and/or damages in connection with the use of this information.
The information and materials may contain hyperlinks to other websites, we are not responsible for the content of any linked sites. The information and analysis provided through hyperlinks to third party websites, while believed to be accurate, cannot be guaranteed by SoFi HK. These links are provided for informational purposes and should not be viewed as an endorsement. The risk involved in using such hyperlinks shall be borne by the visitor and subject to any Terms of Use applicable to such access and use.
Any product, logos, brands, and other trademarks or images featured are the property of their respective trademark holders. These trademark holders are not affiliated with SoFi HK or its Affiliates. These trademark holders do not sponsor or endorse SoFi HK or any of its articles.
Without prior written approval of SoFi HK, the information/materials shall not be amended, duplicated, photocopied, transmitted, circulated, distributed or published in any manner, or be used for commercial or public purposes.


About SoFi Hong Kong
SoFi – Invest. Simple.
SoFi Hong Kong is the All-in-One Super App with stock trading, robo advisor and social features. Trade over 15,000 US and Hong Kong stocks in our SoFi App now.