Lengthening Timeframes
Estimated reading time: 6 minutes
The Longest Time
Regardless of whether or not you like Billy Joel, everyone knows his songs. They’re catchy and melodic. Not to mention, there’s a song title that can be used for almost every topic under the sun, and for that I am thankful.
This week’s column is all about records, or at least impressively long stretches of time for certain things to have persisted. Billy holds the record for most lifetime appearances (150) and most consecutive appearances (90) at Madison Square Garden, so referencing him seems appropriate.
We’ve recently reached some records in markets, and I’m not talking about all-time highs (those were covered in a recent column “The Highs Keep Coming”). This cycle has felt elongated in a variety of ways, and now we have some metrics that prove just how elongated it has been.
Son, Can You Play Me a Memory?
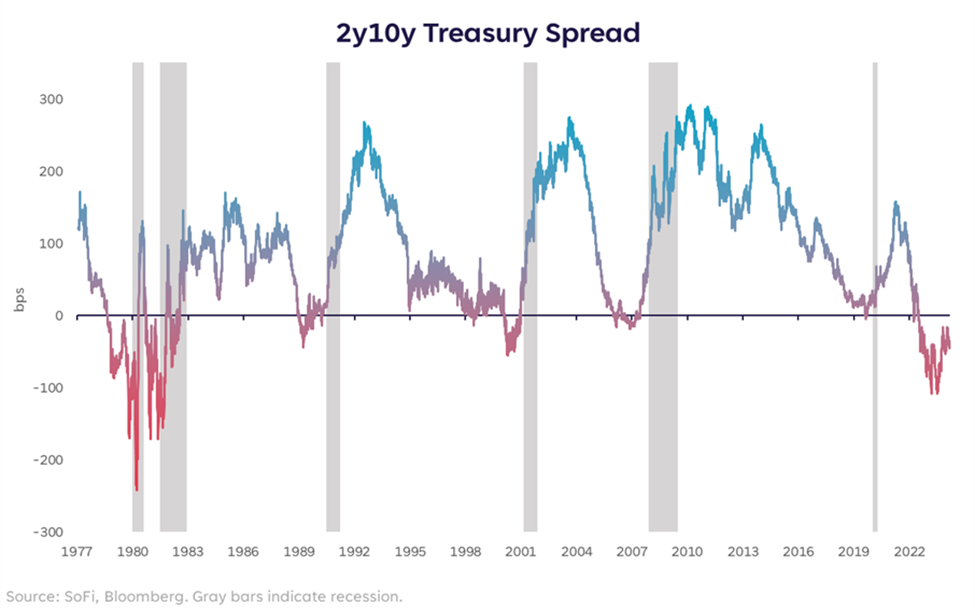
Remember when the yield curve inversion began back in July 2022? I do, but admittedly it’s getting foggier and foggier as time goes on. This inversion between the 2-year and 10-year Treasury yield is now the longest running inversion on record at 423 days, recently surpassing that of the 1978-1980 period.
As the theory goes, yield curve inversions are precursors of recessions. But there’s no scientific length of time when the recession should begin once the yield curve inverts, only averages and historical experiences. It’s also not a perfect science. The curve has inverted (albeit briefly and by very little) without a recession to follow. Nothing is a perfect predictor.
The debate continues over whether or not yield curve inversions work as indicators anymore (cue the “this time is different” camp), but it is worth noting that we are now experiencing the most elongated inversion in history.
In very simple terms, an inverted yield curve where shorter maturities carry a higher yield than longer maturities, suggests that investors expect a decline in long-term rates due to weakening economic conditions.
The narrative today doesn’t include fears over economic conditions, but rather quite a bit of optimism driven by how strong the economy has been. That’s part of why the inversion has become more shallow — as economic prospects improve, long-term yields typically rise.
Despite positive economic surprises, the longest running curve inversion still presents a strong counterpoint to what we might expect in coming quarters.
Hikes to Cuts
Next up is the amount of time we’ve spent between the last Fed rate hike and the looming first rate cut. As of writing this column, it’s been 166 days since the last rate hike, and if Fed funds futures are correct that the first rate cut will come in June, that would mark 236 days between the two.
However, that would only make it the second longest stretch in history, with the period from June 2006 to Sept 2007 being the longest at 319 days.
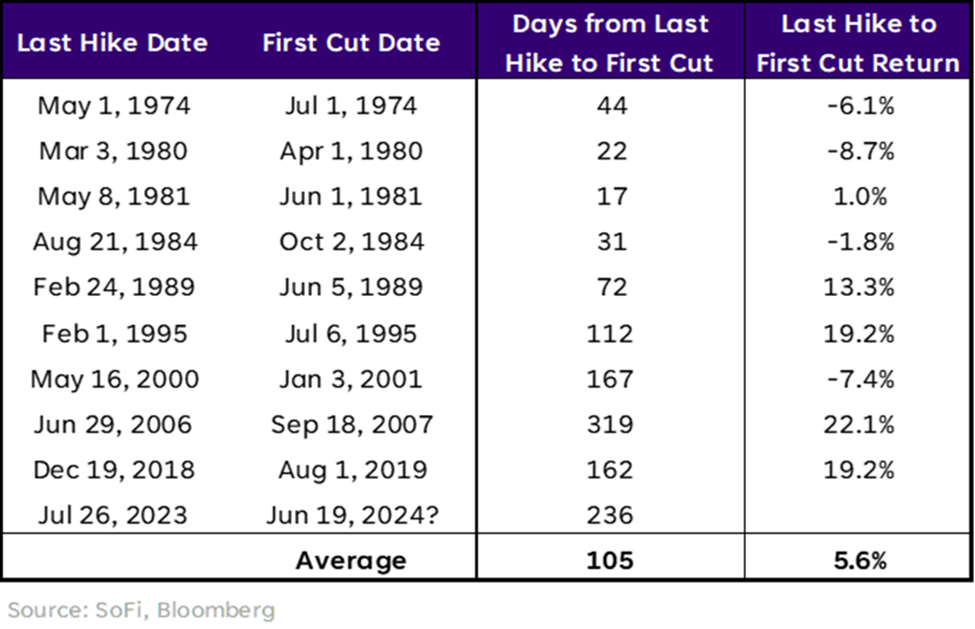
In order to become the longest stretch in history, the Fed would need to hold off on cutting until the November FOMC meeting. We’ll call that improbable, but not impossible.
Nevertheless, the beginning of a cutting cycle is often more precarious than the waiting period beforehand. That’s proven to be true this time as the S&P 500 is up more than 13% since the last rate hike. One could choose to believe that the longer the wait, the higher the market can go. But the higher it goes before we finish the job on inflation and start normalizing policy, the harder it can fall if we don’t stick the landing.
You May be Right
Despite some warning signs and fears over sticky inflation, the market continues to show its resilience, and the saying goes “don’t fight the tape” for a reason. Momentum is a powerful force. Some may even say the market is never wrong, things are priced as they should be at that moment.
Rather than spending too much time dwelling on the signals that have proven to be concerning in the past, we also must recognize what’s happening in the present. One of those data points is that the S&P 500 hasn’t experienced a one-day drop of 2% or more since February 2023. That’s the longest stretch since February 2018.
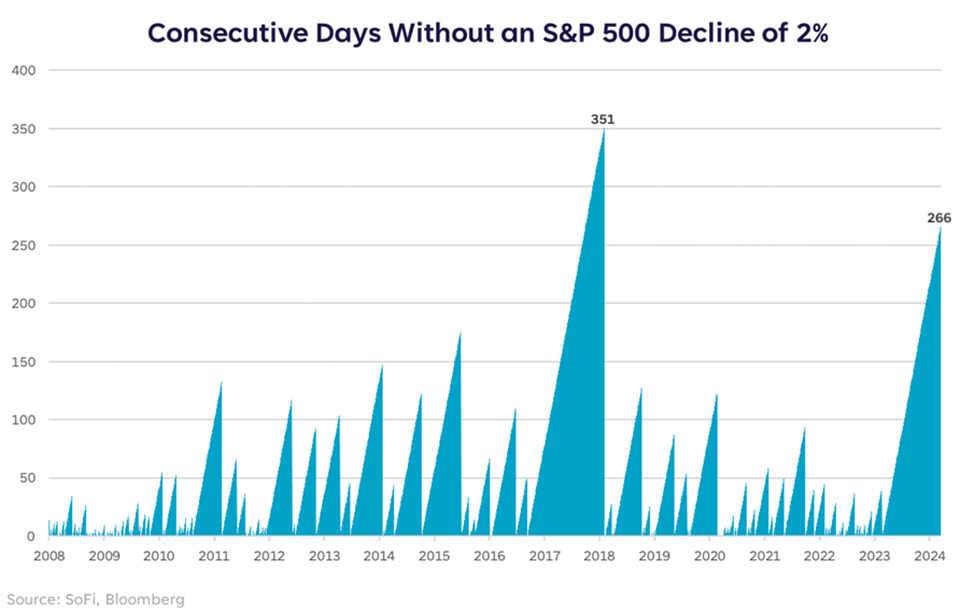
This signal neither sends a warning sign, nor a clear-cut sign of further upward momentum. Instead, it’s simply a testament to how strong the market has been for over a year, particularly during a time when many were expecting a recession.
The desire by investors to search for new opportunities, while maintaining or increasing their allocation to risk assets, is rather remarkable. Much like inflation, the optimism has been sticky.
Disclaimer
SoFi Securities (Hong Kong) Limited and its affiliates (SoFi HK) may post or share information and materials from time to time. They should not be regarded as an offer, solicitation, invitation, investment advice, recommendation to buy, sell or otherwise deal with any investment instrument or product in any jurisdictions. Keep in mind that investing involves risk, and past performance of an asset never guarantees future results or returns. It’s important for investors to consider their specific financial needs, goals, and risk profile before making an investment decision.
SoFi HK does not make any warranties about the completeness, reliability and accuracy of this information and will not be liable for any losses and/or damages in connection with the use of this information.
The information and materials may contain hyperlinks to other websites, we are not responsible for the content of any linked sites. The information and analysis provided through hyperlinks to third party websites, while believed to be accurate, cannot be guaranteed by SoFi HK. These links are provided for informational purposes and should not be viewed as an endorsement. The risk involved in using such hyperlinks shall be borne by the visitor and subject to any Terms of Use applicable to such access and use.
Any product, logos, brands, and other trademarks or images featured are the property of their respective trademark holders. These trademark holders are not affiliated with SoFi HK or its Affiliates. These trademark holders do not sponsor or endorse SoFi HK or any of its articles.
Without prior written approval of SoFi HK, the information/materials shall not be amended, duplicated, photocopied, transmitted, circulated, distributed or published in any manner, or be used for commercial or public purposes.


About SoFi Hong Kong
SoFi – Invest. Simple.
SoFi Hong Kong is the All-in-One Super App with stock trading, robo advisor and social features. Trade over 15,000 US and Hong Kong stocks in our SoFi App now.